
Unemployment In The USA
In the following article, we will be exploring the topic of unemployment within the boundaries of the United States of America. The maps will aid you to understand the unemployment rates.
Employment and Unemployment
Since the dawn of civilization, all the people always needed to do one thing to put the food on the table, “Working”. Today, in the 21st century, Employment is a key requirement for any individual to survive in the society.
However, in modern economy system and in the US Economy, employment doesn’t come out of anywhere. It is an intricate network of systems which has to be created, updated, facilitated, maintained and monitored.
Ultimately, the government decides and chooses the policies related to employment and facilitates the required constitutional and legal framework. Within that, government and private entrepreneurs start up organizations that require labour for their proper functioning. In the process, individuals are able to provide either physical or mental labour which we call “employment” and get paid for their contribution.
Remember this is a super simplified definition of how the system works. In addition, some economic systems such as closed/communist economies employ different techniques for employment.
If you need to explore more on this topic, google terms such as Theory of Employment, How Employment affects the society, Creation of Employment, Different Economic Systems, Keynesian Economic Theory.
So, it is not rocket science to understand that unemployment is the exact opposite of Employment, right? but Economists define this as “unemployment refers to the individuals who are employable and seeking a job but are unable to find a job.”
During times of economic difficulties, such as recessions and declines in the economy, the USA has suffered heavily due to unemployment. Such as during the Great Depression in the 1930’s and the Financial Crisis of 2007. However, in this article, we only explore the US unemployment rate from 2011 to 2019, the “recovery period” since the “Great Recession” in 2007-08.
United States Unemployment Rates Since 2011
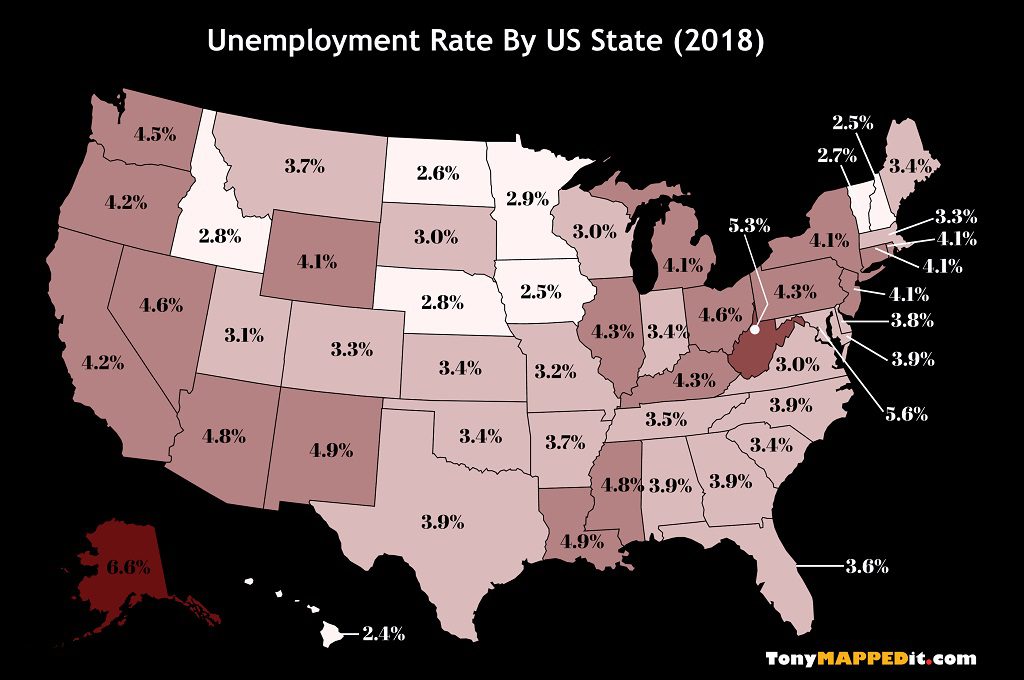
Unemployment Rate By US State in 2018
US unemployment rate of 2018: 3.9%
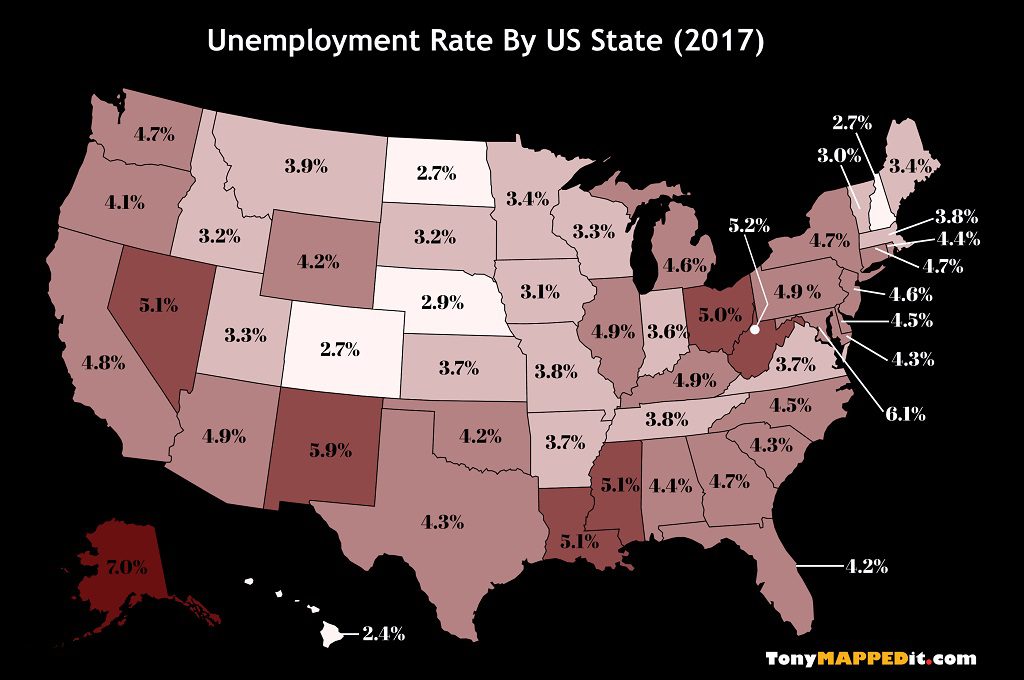
Unemployment Rate By US State in 2017
US unemployment rate of 2017: 4.4%
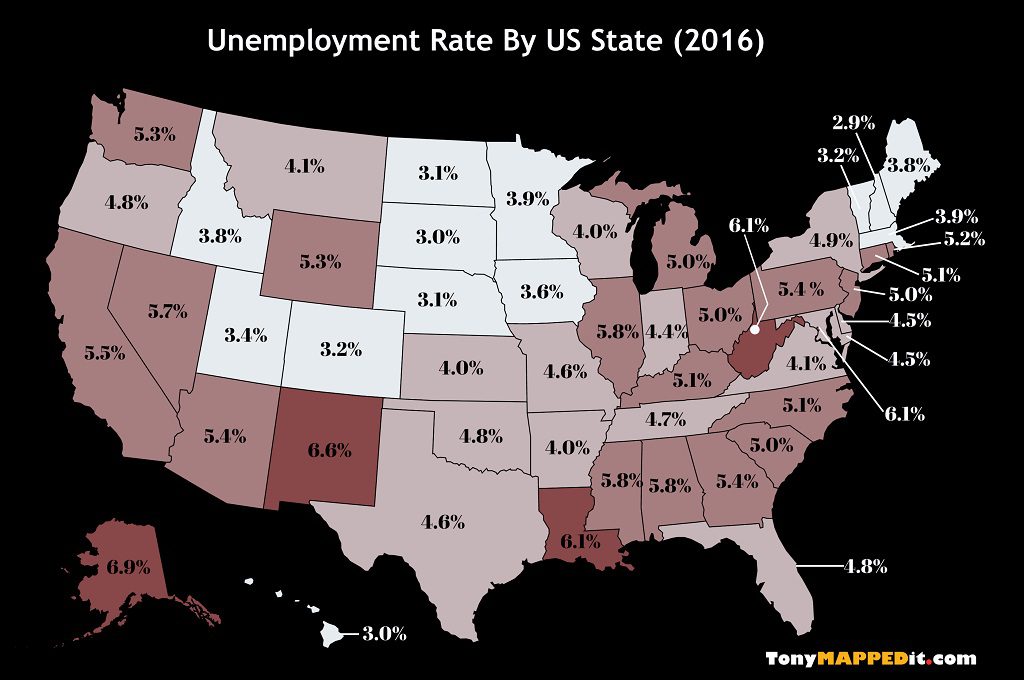
Unemployment Rate By US State in 2016
US unemployment rate of 2016: 4.9%
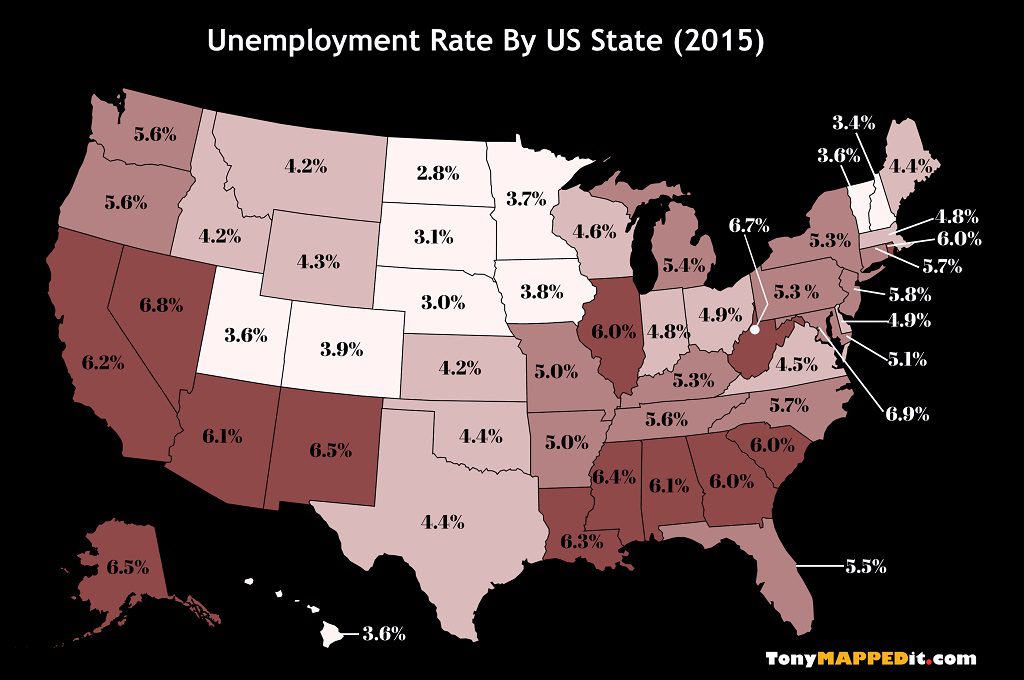
Unemployment Rate By US State in 2015
US unemployment rate of 2015: 5.3%
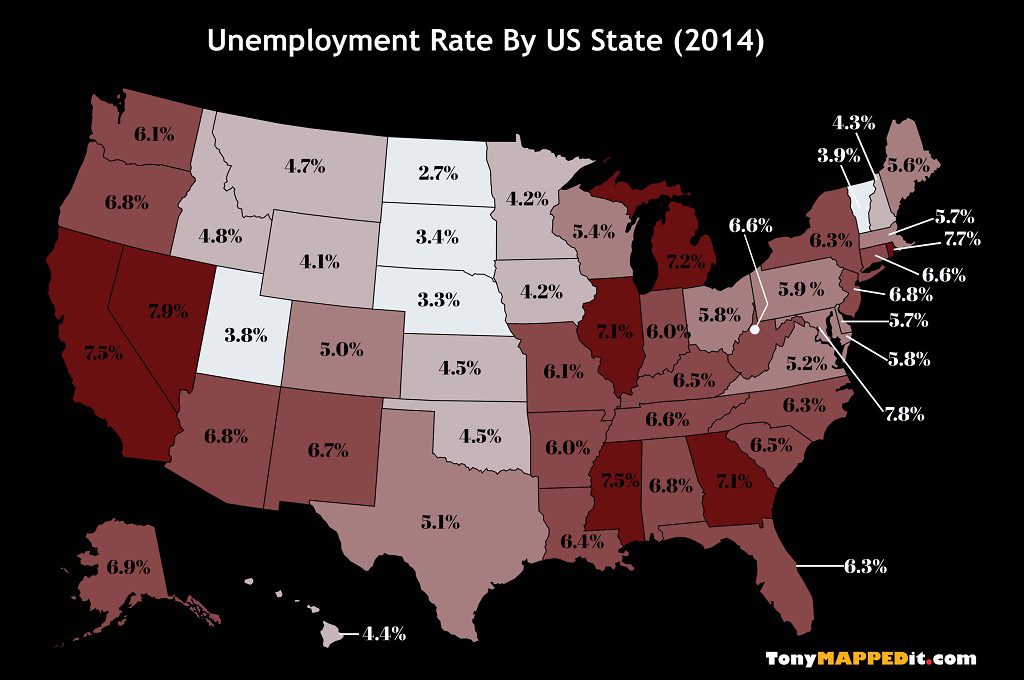
Unemployment Rate By US State in 2014
US unemployment rate of 2014: 6.2%
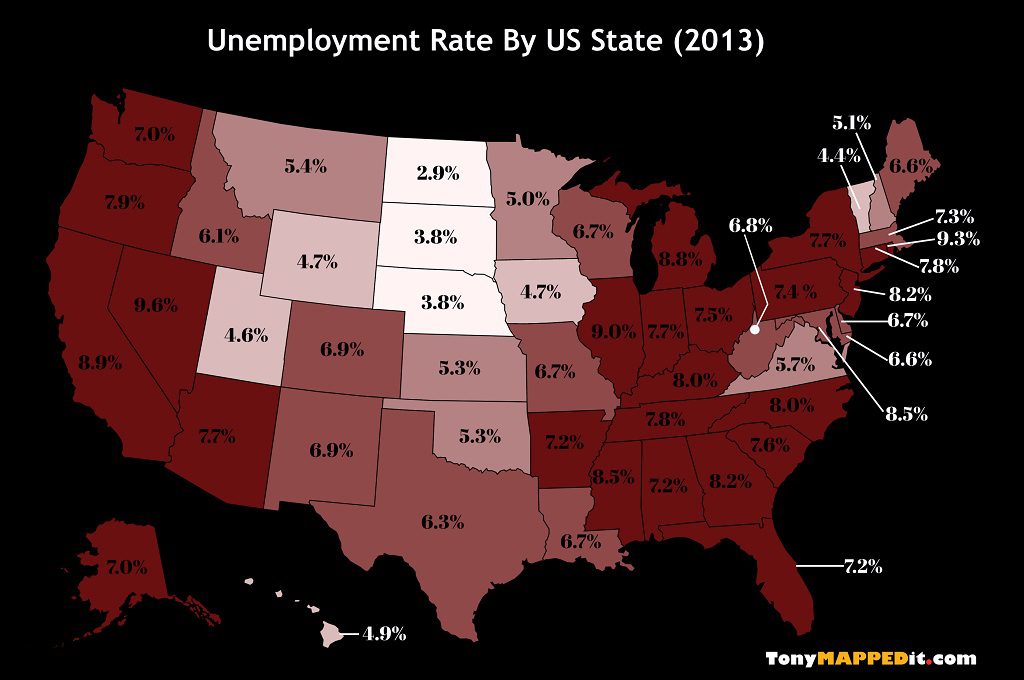
Unemployment Rate By US State in 2013
US unemployment rate of 2013: 7.4%
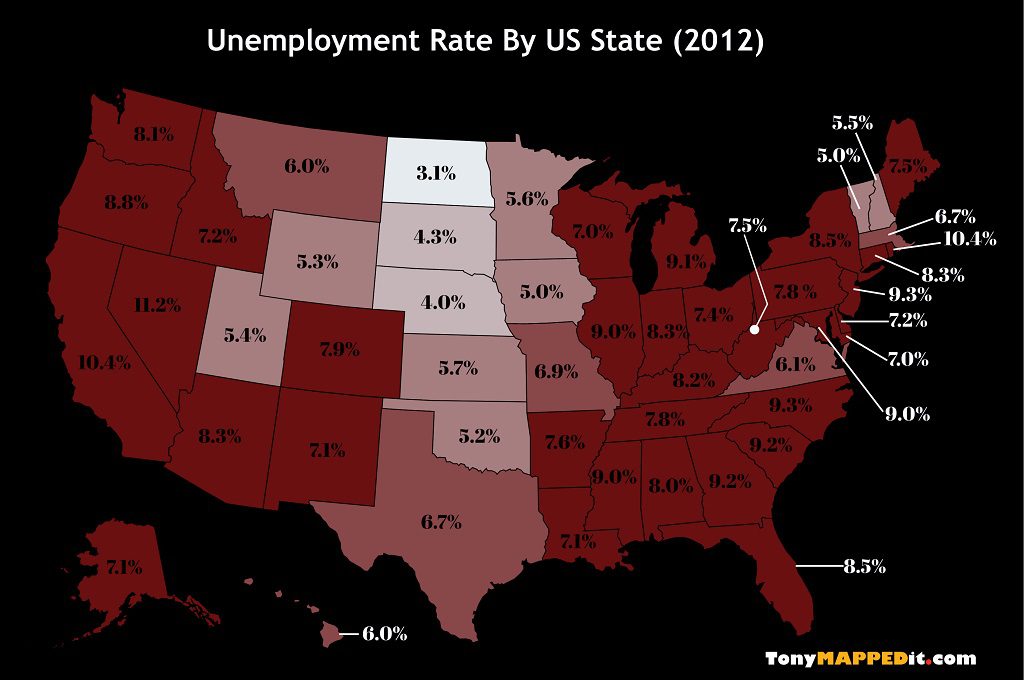
Unemployment Rate By US State in 2012
US unemployment rate of 2012: 8.1%
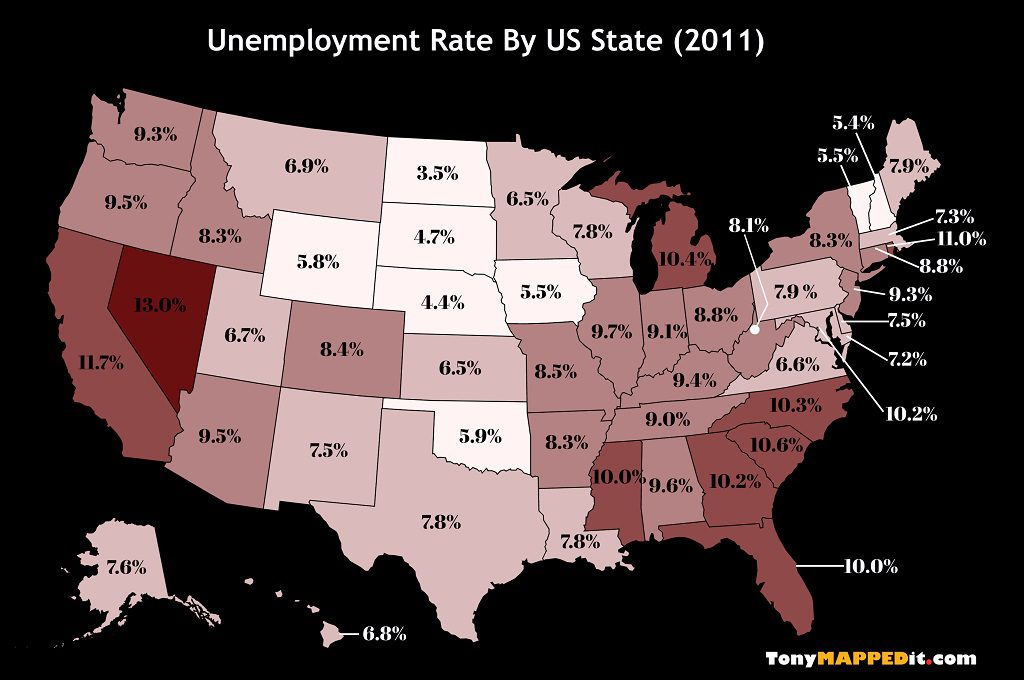
Unemployment Rate By US State in 2011
US unemployment rate of 2011: 8.9%
It is clearly visible that the US economy has added more jobs and has gradually overcome the negative impact of the 2008’s great recession. From an overall perspective, this decrease in general unemployment in the USA has contributed positively towards decreasing the state-wise unemployment in the USA.
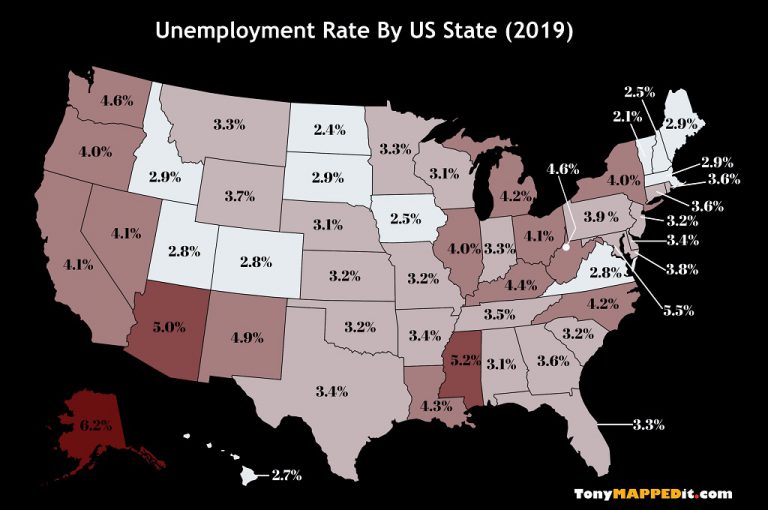
The following lists showcase the top 10 highest and lowest unemployment rates in US States as of July, 2019.
Top 10 States With The Highest Unemployment Rate
- Alaska: 6.3%
- District of Columbia: 5.6%
- Mississippi: 5.1%
- New Mexico: 4.9%
- Arizona: 4.9%
Top 10 States With The Lowest Unemployment Rate
- Vermont: 2.1%
- North Dakota: 2.4%
- New Hampshire: 2.5%
- Iowa: 2.5%
- Hawaii: 2.8%
How Has Unemployment Developed Between 2011 – 2018?
Many steps taken by the US Federal Government contributed towards the overall recovery of the economy from the recession period and therefore, towards the recovery of the unemployment rate to a vigorous level. They are,
- The enactment of the Economic Stimulus Act of 2008. This introduced tax rebates/refunds to the affected companies.
- The enactment of the Housing and Economic Recovery Act.
- The introduction of the American Recovery and Reinvestment Act of 2009 by the congress. The $787 billion economic stimulus package enabled the macro-economic conditions to stabilize.
- Acquisition of major financial institutions that were struggling.
During the financial crisis, many corporations, and institution laid-off workers and excess employees and as a result, many workers lost their jobs. However, these policies implemented and subsidies provided by the government facilitated the gradual recovery of the economy and the unemployment rate. In July 2019 alone, the USA added nearly 167,000 jobs to the economy.
In 2019, during the past six months, the state which has the highest unemployment rate is Alaska with a rate of 6.4%.
As of July 2019, the state that records the lowest unemployment rate is Vermont, with a record low rate of 2.1%.
It is difficult to pinpoint only one state though various reports have suggested that the following states have added more jobs compared to the rest of the US states.
– Oregon
– North Carolina
– Texas
– West Virginia
– Arizona
– Colorado
The city of Yuma in Arizona records the highest rate of unemployment among US Cities. The following are the top 5 cities with the highest unemployment:
1. Yuma, Arizona 20.9%
2. El Centro, California 19.3%
3. Visalia-Porterville, California 9.3%
4. Bakersfield, California 8.2%
5. Merced, California 8.1%
The city of Ames in Iowa records the lowest rate of unemployment among US Cities. Following are the top 5 cities with the lowest unemployment:
1. Ames, Iowa 1.8%
2. Urban Honolulu, Hawaii 2.1%
3. Iowa City, Iowa 2.1%
4. Kahului-Wailuku-Lahaina, Hawaii 2.1%
5. Sioux Falls, South Dakota 2.1%
0 Comments